What kind of data will the CommonLit Assessment Series give me?
This article is intended only for customers and partners using the Assessment Series.
Overview
The Assessment Series measures reading comprehension, specifically how well students comprehend and apply standards to analyze texts. The tests include multiple-choice questions that align to Common Core State Standards R.1-R.6 or your state’s equivalent standards.
Each assessment provides data on your students' performance on end-of-grade-level reading comprehension expectations. You can view the following data on the Analyze Data page:
- Scaled Scores
- Percentile Rankings
- Overall and Standards Percent Correct
- Growth Data (available once students have taken more than one assessment)
📁 You can also download a Question Report. This report includes students' Scaled Scores, Percentile Rankings, and overall Percent Corrects as well as how they performed on each individual question and the standard assessed by the question. You can download this report at the bottom of the Analyze Data page by clicking the Download Question Report button.
Scaled Scores
You can view a student's scaled score in the Overall Performance by Student table. Scaled scores account for both the number of questions students answered correctly and the difficulty of a test. These scores are a valid measure of students’ reading comprehension and text analysis abilities. Because scaled scores account for the difficulty of each test/the questions on a test, this ensures that students’ scores reflect their abilities even if one Assessment Series test is slightly easier or harder than another.
CommonLit reports students’ scores on a scale that runs from 150-250, with higher scores indicating higher student performance.
💡 Note: Because these scores measure students’ performance against end-of-grade-level expectations, it is typical for students to start the year with lower scores.
Student Performance Groups
Student performance groups show how students are performing relative to end-of-grade-level expectations in reading comprehension and text analysis. Students will be placed into one of three performance groups based on their scaled score:
- Below or Approaching Grade Level (150 - 204): Students are currently below or approaching end-of-year expectations for understanding and analyzing texts.
- On Grade Level (205 - 219): Students currently meet end-of-year expectations for understanding and analyzing texts.
- Above Grade Level (220 - 250): Students currently exceed end-of-year expectations for understanding and analyzing texts.
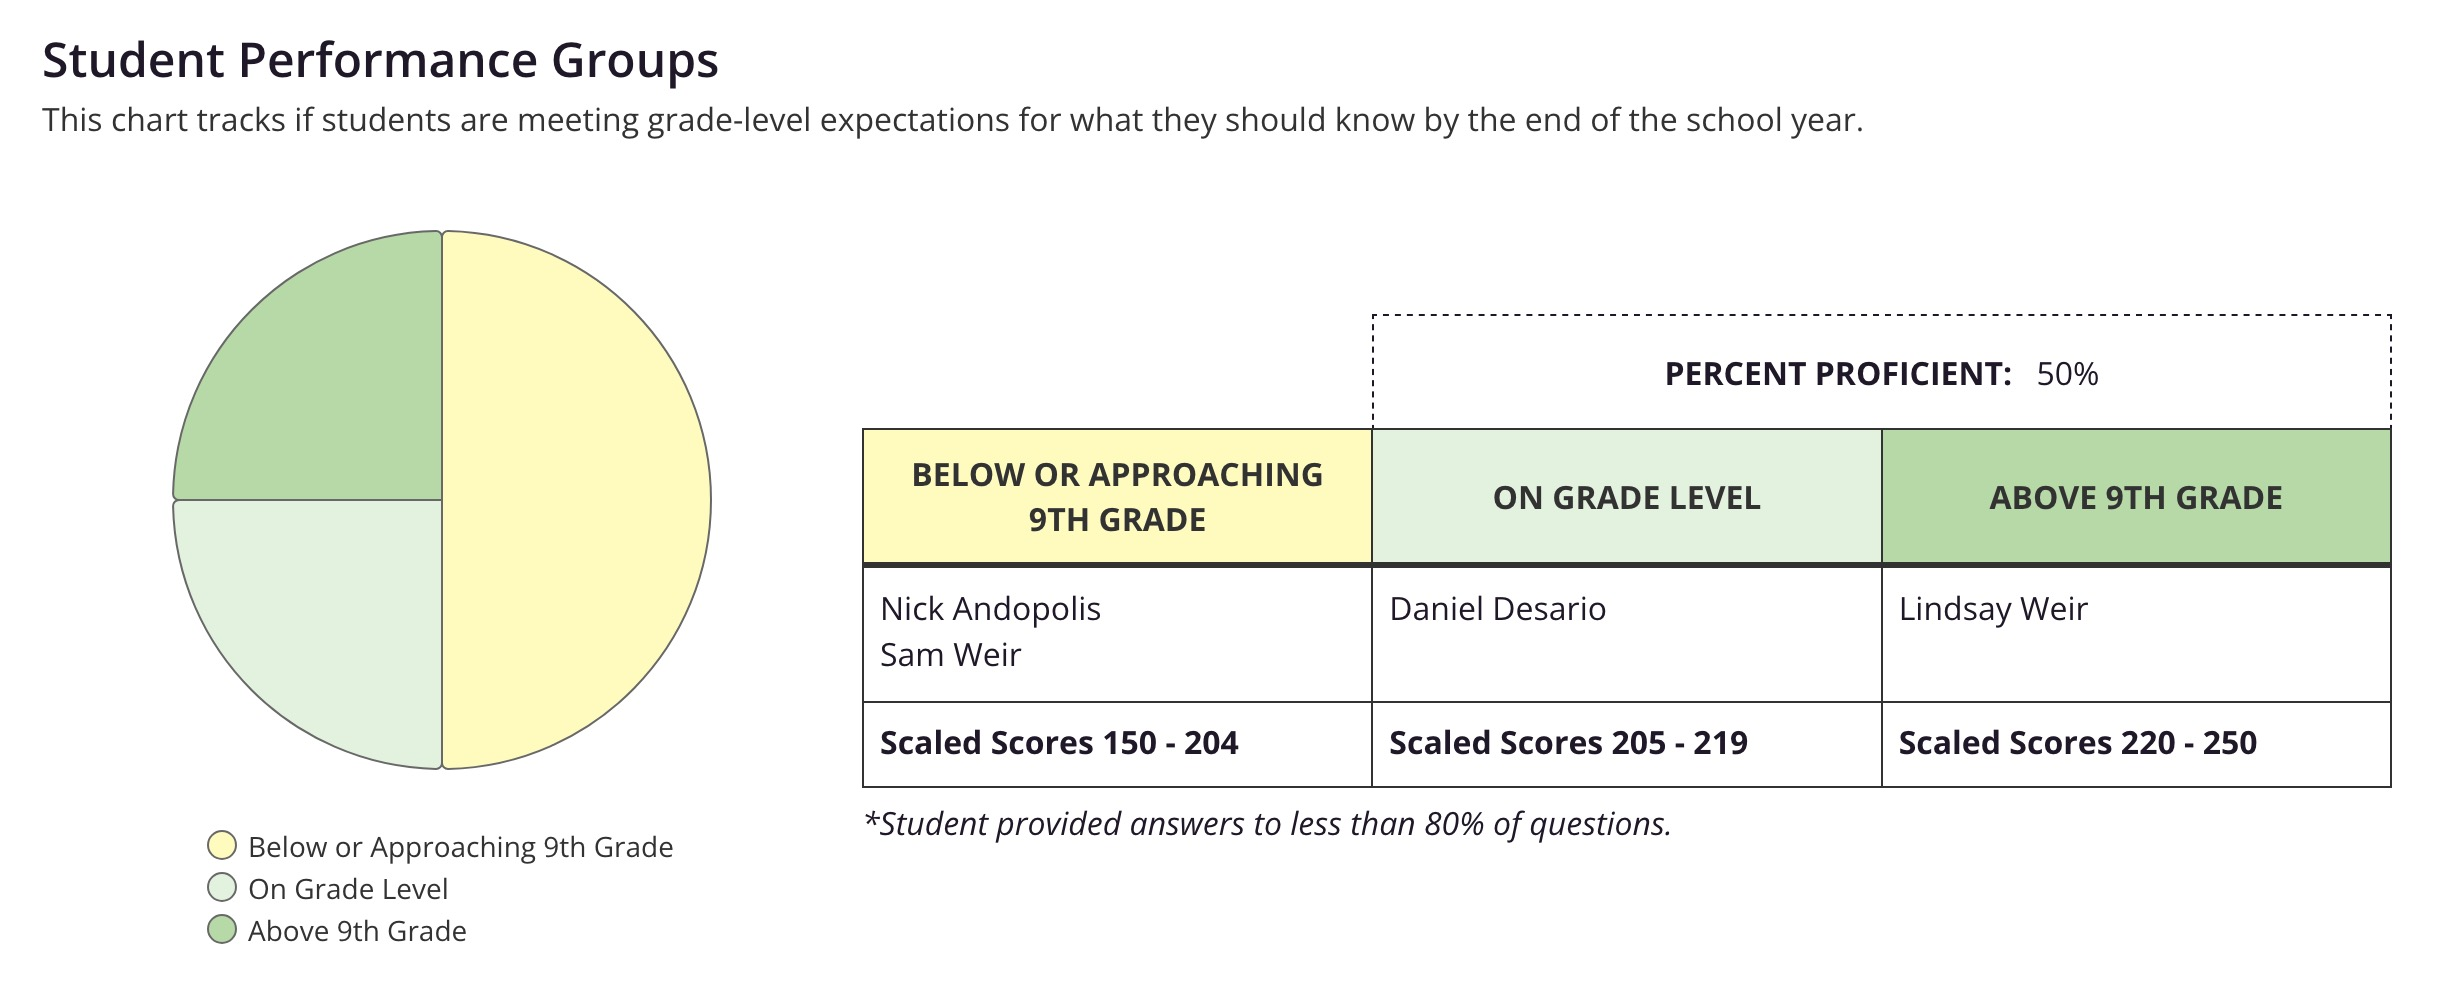
Percent Proficient
In the Student Performance Groups table, you will see the Percent Proficient metric. Percent Proficient is the percentage of students scoring On Grade Level and Above Grade Level within a class, school, or district. For example, if 20 students in a class have taken an Assessment Series test, with 7 of those students On Grade Level and 3 Above Grade Level, the Percent Proficient for that class would be 50%.
Students that are in the On Grade Level or Above Grade Level groups have demonstrated proficiency on end-of-grade-level reading comprehension expectations as measured by the Assessment Series. Because performance groups on the Assessment Series are based on end-of-grade-level expectations, it is common for many students to not demonstrate proficiency at the beginning of the school year.
Percent proficient data can be useful for looking at patterns across classes, schools, or districts.
Percentile Rankings
You can view a student's percentile ranking in the Overall Performance by Student table. Percentile rankings show how students’ scaled scores compare to all other CommonLit students who took the same test at the same grade level in the current school year. For example, a student who receives a percentile ranking of 80 has a scaled score that is the same as or higher than 80% of the same-grade students who have taken the same test that year.
These scores update in real time as more students submit any given Assessment Series test and they are not nationally normed percentile rankings.
Please note, percentile rankings are only calculated for students who took an assessment at the grade level of their account (e.g. a 9th grade student who completed the 9th Grade Post-Assessment).
Overall and Standards Percent Correct
You can view a student's overall percent correct score as well as their percent correct score on assessed reading standards in the Overall Performance by Student table.
Unlike scaled scores, percentage scores are raw scores that do not account for the difficulty of the questions on a test. They are not a valid measure of overall or standard-specific student performance.
Please note, CommonLit’s scoring procedure treats not answering a question the same as getting a question wrong. If a student skips a question, this question will be factored into their Percent Correct score as incorrect.
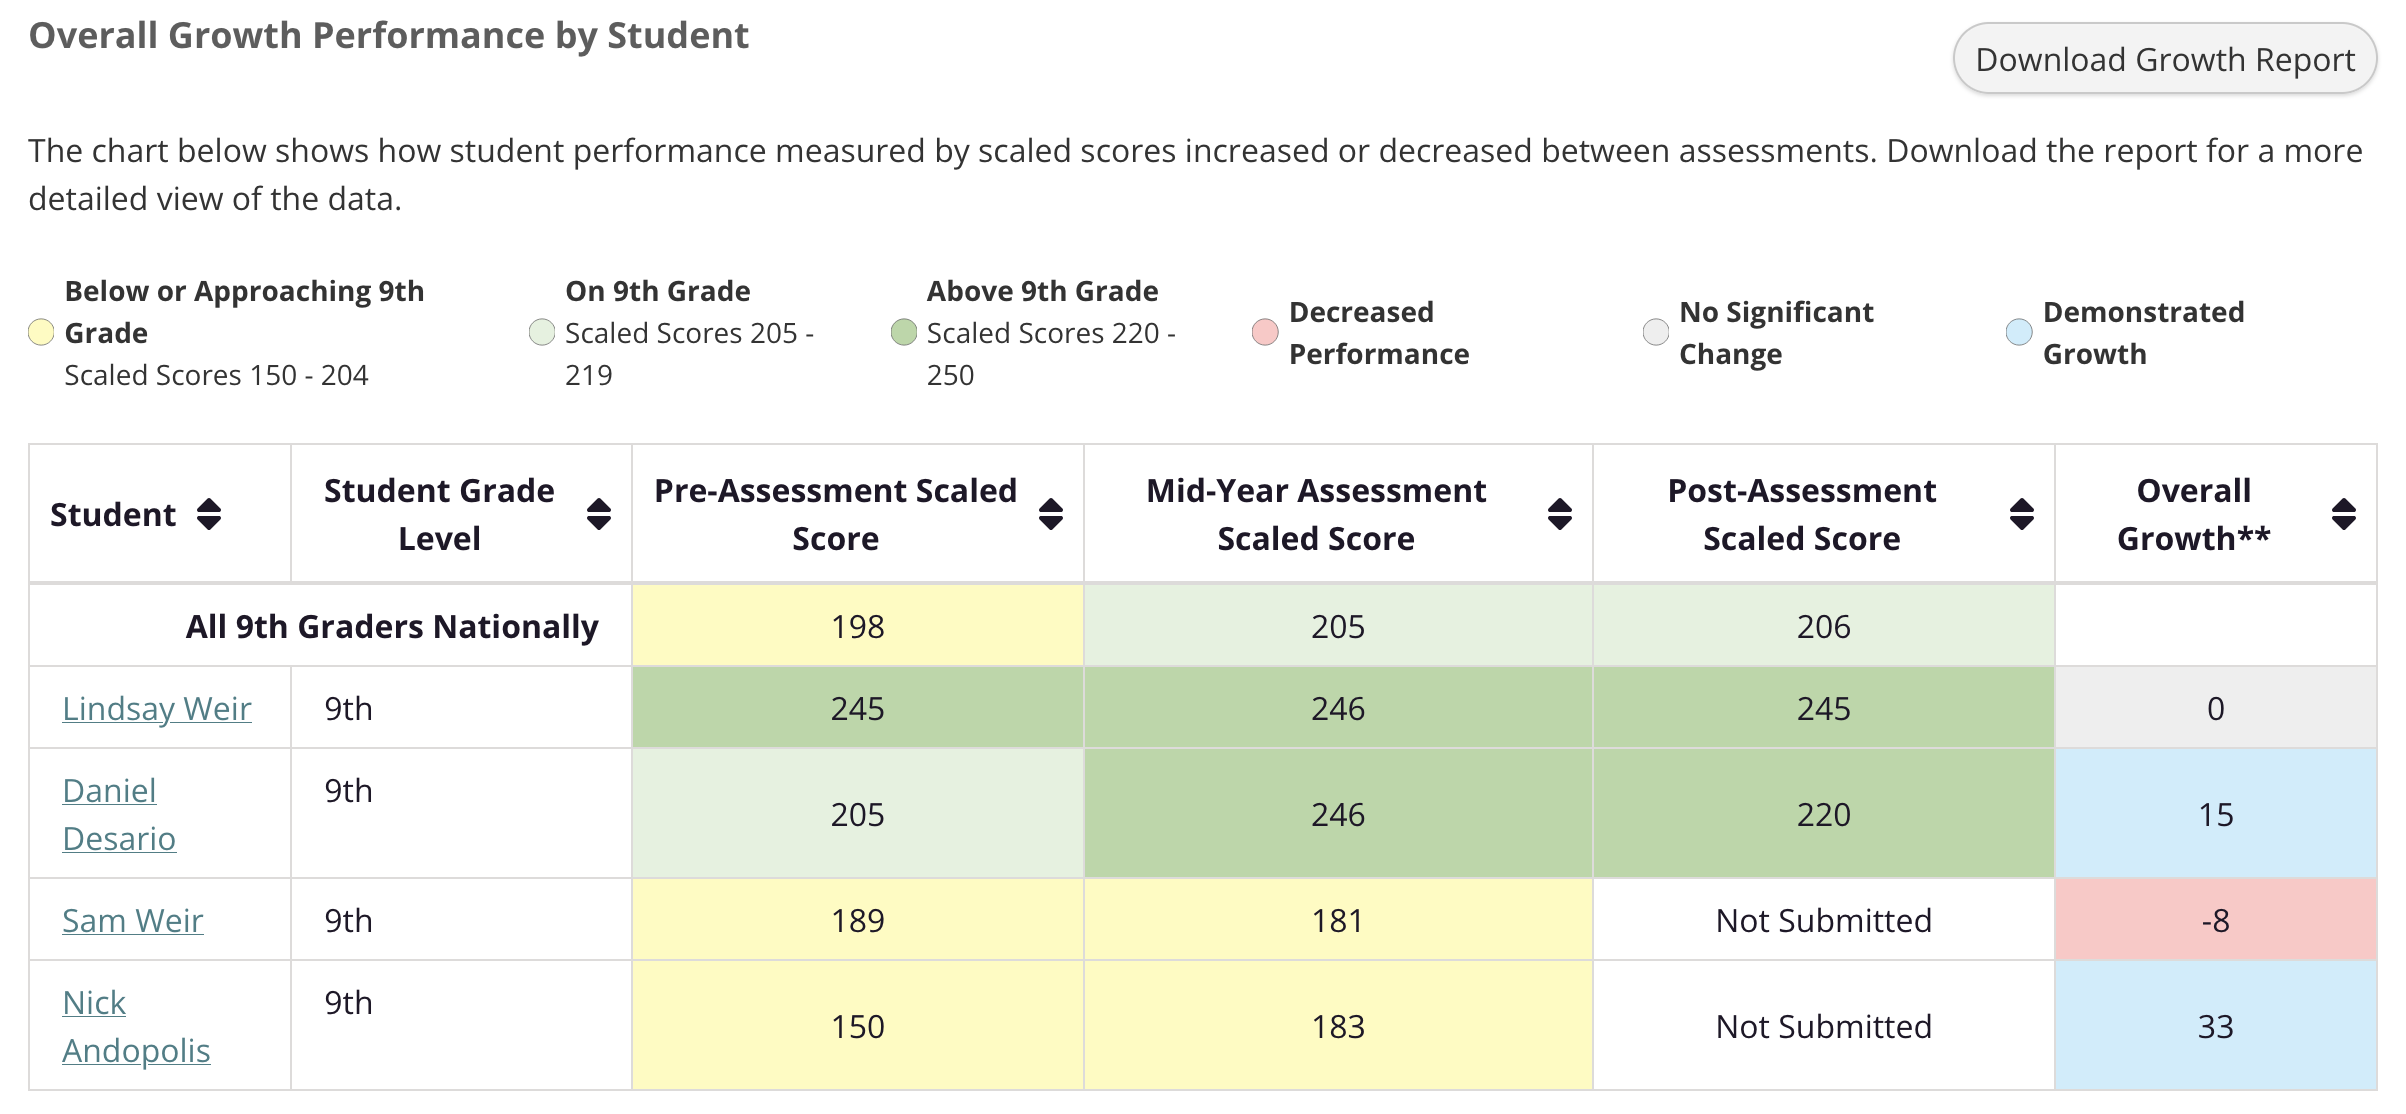
Growth Data
After administering more than one test, you will be able to see growth data by clicking Assessment Series > Growth Data . Growth scores are the difference between a student’s earliest and most recent scaled score within one school year. For example, a student who earned a scaled score of 200 on the Pre-Assessment and a scaled score of 210 on the Post-Assessment would have demonstrated growth of 10 scaled score points throughout that school year.
Within growth data displays, No Significant Change (gray) signifies a change in scores between tests that may be due to minor fluctuations in student performance rather than statistically significant growth. When growth is marked as Demonstrated Growth or Decreased Performance, educators can be confident that this change in scaled score indicates a true change in student reading comprehension.
ℹ️ For more information on the data provided by the CommonLit Assessment Series and guidance on interpreting scores, please refer to the following resources:
Want school- and district-wide data for your team? Learn more about School Essentials PRO here.